


DALLAS — For the data novice, a recent webinar, “Data Insights from Virtual Platforms — Virtual Expo! Expo! Case Study,” presented by the Center for Exhibition Industry Research (CEIR), broke down the complex science of data analysis into understandable, relatable “a-ha” moments.
The event featured Arjun Chakravarti, MBA, Ph.D., Managing Director and Principal, and David Richardson, Ph.D., CAP, Principal and Head of Analytics Solutions, both of COGKNITION Analytics, who worked closely with Scott Craighead, CEM, Vice President of Exhibitions and Events, International Association of Exhibitions and Events (IAEE), to analyze participation data from the 2020 virtual/digital edition of Expo! Expo! The goal was to provide perspective on how various data insights might be used to design a hybrid event model for the show in the future.
Related. The Data Shows Now Is the Time For Safe Reopening of Trade Shows
“The most important difference between live and virtual events is that people are only a mouse click away from leaving your digital event, whether it is for their work or to deal with children or household needs,” said Richardson. “It requires that you not only track the people who come but when they come and when they leave so you have a meaningful measure of engagement. We’ve found ways to leverage that info to give us insights that are not possible with live events.”
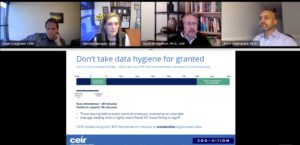
But it’s far more complicated than that. Raw data can give you an inflated view of what the attendee did. He or she might have left in the middle of the event but would still be credited with watching if the computer window was left open. That’s where data “hygiene” is important: analyzing average attendance times to make sure they’re not longer than the entire session, for example, and removing the outliers to get a clearer picture.
Related. CEIR Predicts Recovery in Second Half of 2021
Even evaluations can be tricky because many virtual meeting platforms are not customizable. So if you’re used to collecting scores on a 4.0 or 5.0 scale, you might not be able to do this with an online event and could lose that annual benchmark.
It gets even more complicated.
The speakers discussed the many ways evaluations can go wrong. They might not be easy to find if attendees opt out of certain notifications and are not reminded to fill them out. The presentation tools might be challenging for the speakers to master because they have never used the platform. People might have to jump out of the educational event for a scheduled appointment. The scenarios are many, and all affect the data.
What about those sessions with low scores? It could be a problem with the session itself, with the content not meeting the session description, or perhaps it is a repeated session from previous years, so people who have attended in the past might leave if there appears to be nothing new.
Related. New Partnership With Evolio Expands Explori’s Reach
IAEE had expected higher engagement around pre-recorded sessions, but that turned out not to be the case. “Attendees are juggling personal and work demands, and they prioritize live events at the expense of on-demand,” said Chakravarti. “They rarely come back to it. You have to move on-demand away from live content.”
The deepest dive COGKNITION Analytics took into the Expo! Expo! data brought demographics into the mix. “At the end of the day, not all attendees are created equal,” said Chakravarti. The demographics from Expo! Expo! showed that people who were in event ops vs. event marketers, women vs. men, and those in different age groups consume events differently.
In the end, the goals, aspirations and pain points of attendees are the “art” behind the data. “In this industry, ‘up and coming’ attendees want to meet people and become known. Their higher goals are around networking and how to contribute to their organization and the industry. They will want to collaborate in person to achieve this,” said Chakravarti.
And that is the question: How do you take all this data and bring it together from a planning and design perspective?
“It has been an interesting journey,” said Craighead, “coming up with takeaways to apply for future events. “Now we have a lot more data points to look at, which is the benefit of virtual events.”
Reach Arjun Chakravarti and David Richardson at info@cogknition.com and Scott Craighead at scraighead@iaee.com or (972) 687-9227