


 The COVID-19 pandemic continues to make its presence felt in the trade show industry this year even as many locations slowly reopen. However, the timetable of bringing about a return to a “new normal” pushed many organizations into embracing a total virtual technology environment.
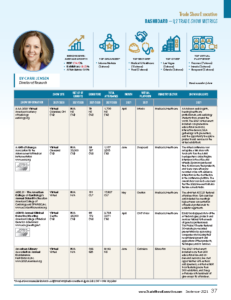
For many years, the Trade Show Executive (TSE) Dashboard of Trade Show Metrics had been published monthly, sharing a snapshot of trade show activity. However, the pandemic outbreak moved TSE to revise the 2021 Dashboard. Instead of monthly accounts, quarterly reports will be published, beginning with our first quarter 2021 Dashboard shared in the June edition. Also, rather than featuring only in-person shows, TSE includes in-person, hybrid and virtual shows. To further the analysis, TSE will highlight the leading virtual providers as many of the shows are virtual or hybrid.
Click here for the entire Q2 Show Metrics Dashboard.