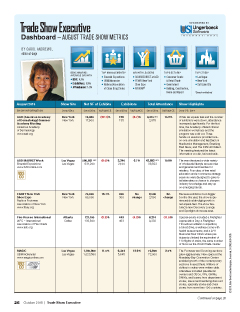
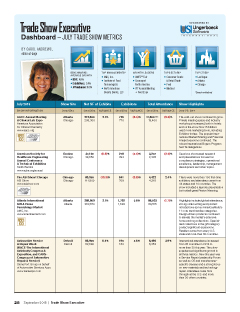
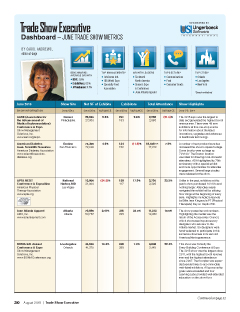
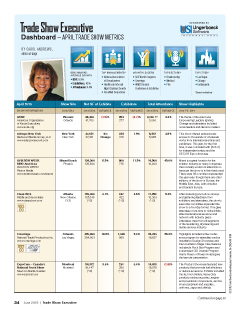
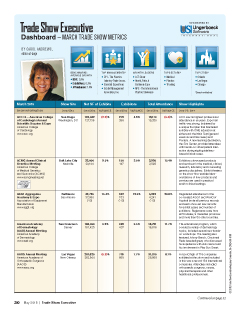
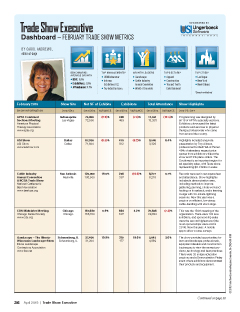
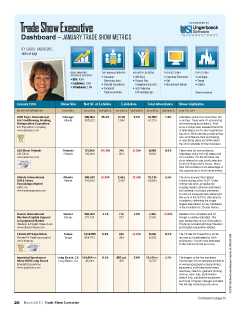
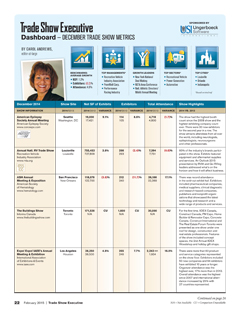
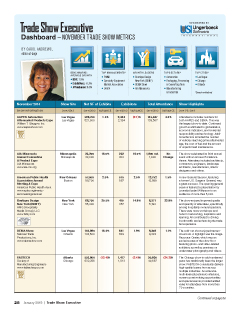
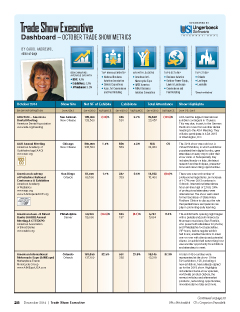
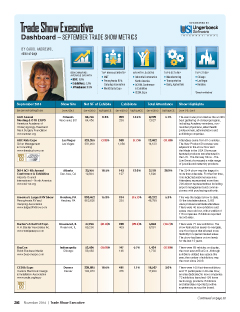
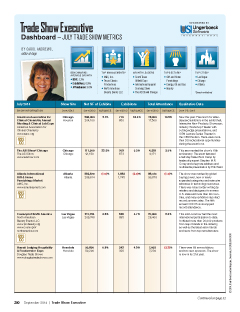
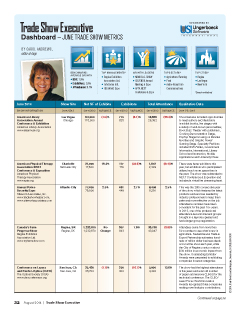
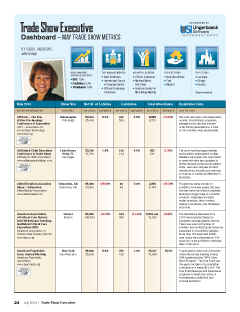
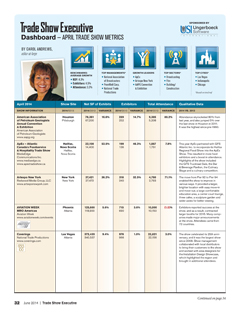
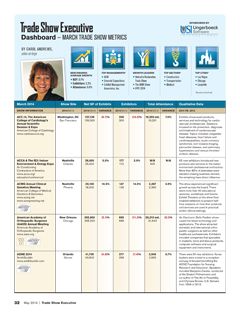
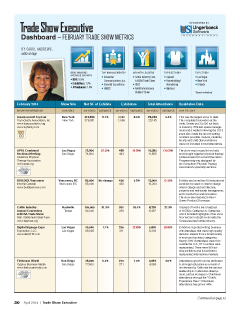
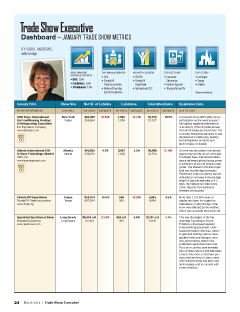
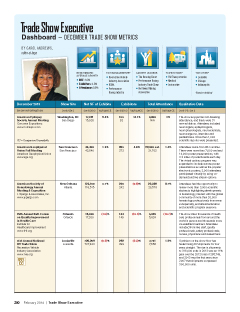
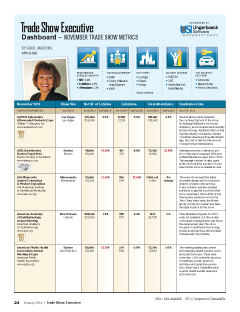
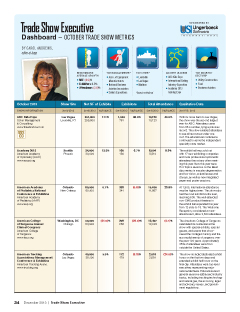
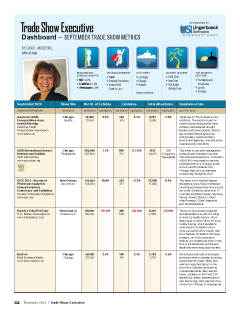
Trade Show Executive’s Dashboard is the authoritative resource for tracking the monthly performance of trade shows. This report includes a statistical review of shows held in the prior month, monthly and quarterly graphs, and also lists other significant characteristics such as quality of attendees, sales transactions and sponsorship growth. Look below to see how shows have been performing in recent months: