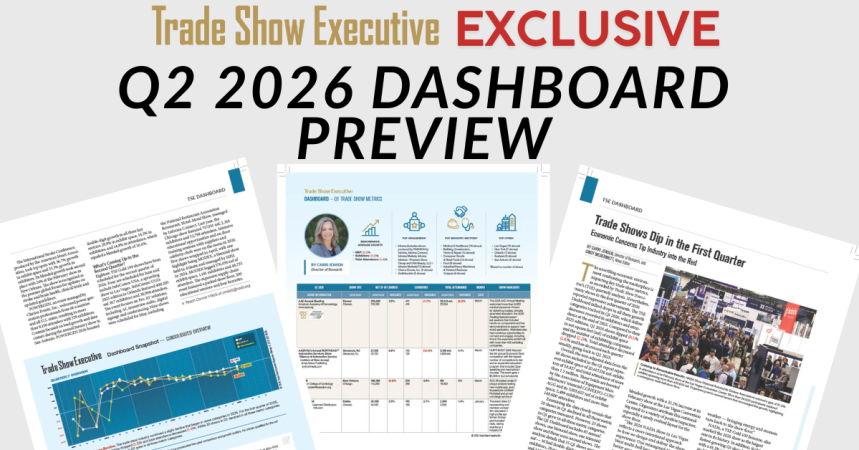
CHICAGO — How do your shows and your competitors stack up against each other in terms of traditional event performance? Who’s seeing attendance growth and who’s seeing exhibitor declines? What are event organizers adding to their show floors to make an impact?
At the start of each quarter, Trade Show Executive (TSE) publishes a data analysis on the shows that it tracks performance metrics for, and this quarterly report reflects trends within the industry and the macroeconomic and geopolitical factors that impact the business. Self-submitted data highlights which shows are seeing growth — and where — along with new features in the Show Highlights section.
“The TSE Dashboard tracks quarterly and annual trade show performance — both qualitative and quantitative,” said Carri Jensen, TSE’s Director of Research. “The collection of show data provides a state-of-the-industry report that helps both new and seasoned show organizers monitor trends and make educated forecasts and business decisions. Young executives can learn how their event stacks up against other brands in their market in the key metrics of net square feet of exhibit space, number of exhibiting companies and attendance; and gain insight into some of the successful features shows are implementing to generate growth and higher exhibitor and attendee satisfaction.
“Exploring the report is a quick read that will enable young professionals to familiarize themselves with events of all sizes and across all industry sectors with a spotlight on the quarter’s top performers. See what new shows are entering the market and learn what the largest and most established shows are doing to continue a trajectory of growth and leadership. In addition to obtaining reliable trade show data, a show’s active participation in the TSE Dashboard increases the event’s visibility, expanding opportunities for potential connections and industry partnerships.”
The next Dashboard report goes live on September 1, but TSE is giving the Young Professionals Corner (YPC) the inside scoop on what the data is telling us so far about the industry’s health in 2026.
Key Data Points
For all shows taking place from April-June 2026, TSE reports the following data highlights:
- Net square footage of exhibit space fell 1.4% in Q2, a steeper drop than the -0.1% seen in Q1 2026
- The number of exhibitors fell 0.1% in Q2, representing a stronger performance than Q1 2026 shows which saw a 2.2% drop in exhibitors
- Attendance saw its first quarter of gains in a full year, growing 1.0% in Q2 compared to its 1.4% drop in Q1.
- Out of the 75 shows tracked in this Dashboard, 47 grew their show floors, 44 saw exhibitor growth and 47 reported attendee gains, with 31 shows growing in all three categories
- 16 shows declined in all three metrics, less than the 21 that fell in all three in Q1 2026
Standout Shows
Here are the shows that increased their net square footage of exhibit space, number of exhibitors and number of attendees by double-digit rates!
- Data Center World, Informa Markets
- eMerge Americas, eMerge Americas LLC
- F&B@Sea, Informa Markets
- h+h americas, Koelnmesse
- IEEE/CVF Conference on Computer Vision and Pattern Recognition (Institute of Electrical & Electronics Engineers/Computer Vision Foundation)
- Luxury, RX
- Special Operations Forces Week Exhibition, MCI USA
What It All Means
TSE data shows that on a quarter-to-quarter basis, the declining growth averages that have been seen in the last couple of reports are beginning to stabilize.
Shows that identify themselves as being in disruptive or fast-evolving sectors like technology and AI infrastructure are among those tracking the biggest gains in attendance, while the sectors they serve continue to grow exponentially.
Other shows have credited their increase in visitors to the introduction of new experiential elements, like product demos and special events, and the expansion into adjacent verticals.
Related. New Freeman Trends Report Highlights the Untapped Potential of Unstructured Learning
Of the shows that tracked declines in metrics, some organizers shared the challenges they were up against, including reduced travel budgets of participating companies, reduced shipping of products due to tariffs and overall industry uncertainty. The cited challenges highlight that while economic pressures may be slightly easing for shows across the board, there are still hurdles to overcome within specific industry segments that are more deeply impacted by tariff policies.
How to Get More TSE Data
You can subscribe to TSE Magazine in print or online to be among the first to receive our original, award-winning research reports on the industry.